Fundamental analysis is a method investors use to determine a company’s true intrinsic value. Rather than focusing on price charts and short-term patterns (like technical analysis), it examines the business itself — how it generates revenue, its financial stability, management quality, competitive position, and future growth potential.
The goal? Identify whether a stock is undervalued (a potential bargain), fairly valued, or overvalued (possibly a sell or avoid). This approach is especially popular for long-term investing.
The foundation of fundamental analysis lies in three key financial statements:
Shows revenue, expenses, and net profit over a period. It reveals profitability and how efficiently the company turns sales into earnings.
A snapshot of assets (what the company owns), liabilities (what it owes), and shareholders' equity at a specific point in time.
Tracks actual cash moving in and out of the business from operations, investing, and financing activities. Often considered the most revealing — "cash is king."
Companies with consistently strong, clean financials across these reports are frequently classified as blue-chip stocks — large, stable, industry-leading firms. These are ideal if you’re seeking low-risk investments with reliable dividend yields comparable to real estate, bonds, or gold.
That said, explosive capital growth (e.g., turning $1 into $10) rarely comes from analyzing statements alone. High-multiplier returns often require faster-moving strategies, such as participating in trading competitions, following expert signals, or joining active trading communities where real pros demonstrate high-conviction trades.
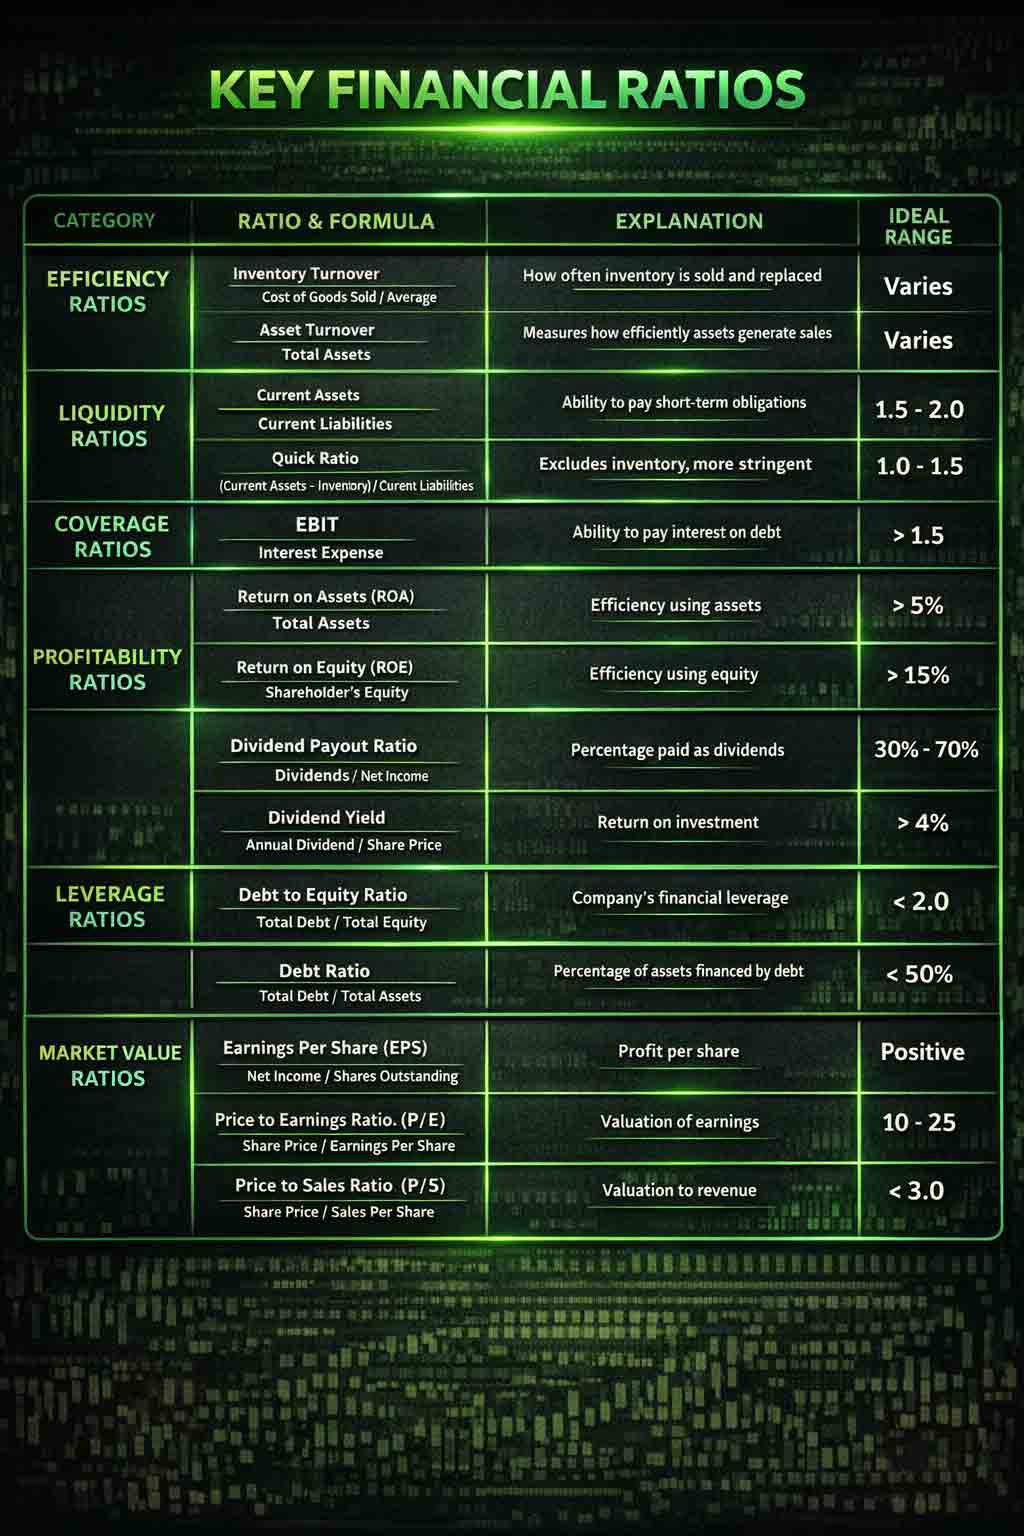
Stock price divided by earnings per share. A lower P/E can signal undervaluation; a higher P/E often reflects strong expected future growth.
Profit allocated to each outstanding share. Look for consistent EPS growth over multiple quarters/years — it's a strong sign of improving profitability.
Year-over-year increase in sales. Steady, organic growth (not just from acquisitions) indicates a healthy, expanding business.
Important reality check: By the time a company shows “solid” public metrics like an attractive P/E, it’s already widely known and traded. Institutional investors, private equity firms, and insiders often position themselves before reports hit the public. Retail traders using only free online data are frequently one step behind.
Many experienced traders bridge this gap by joining exclusive communities or networks where merger activity, insider positioning, or high-conviction trades are discussed early — before the broader market reacts.
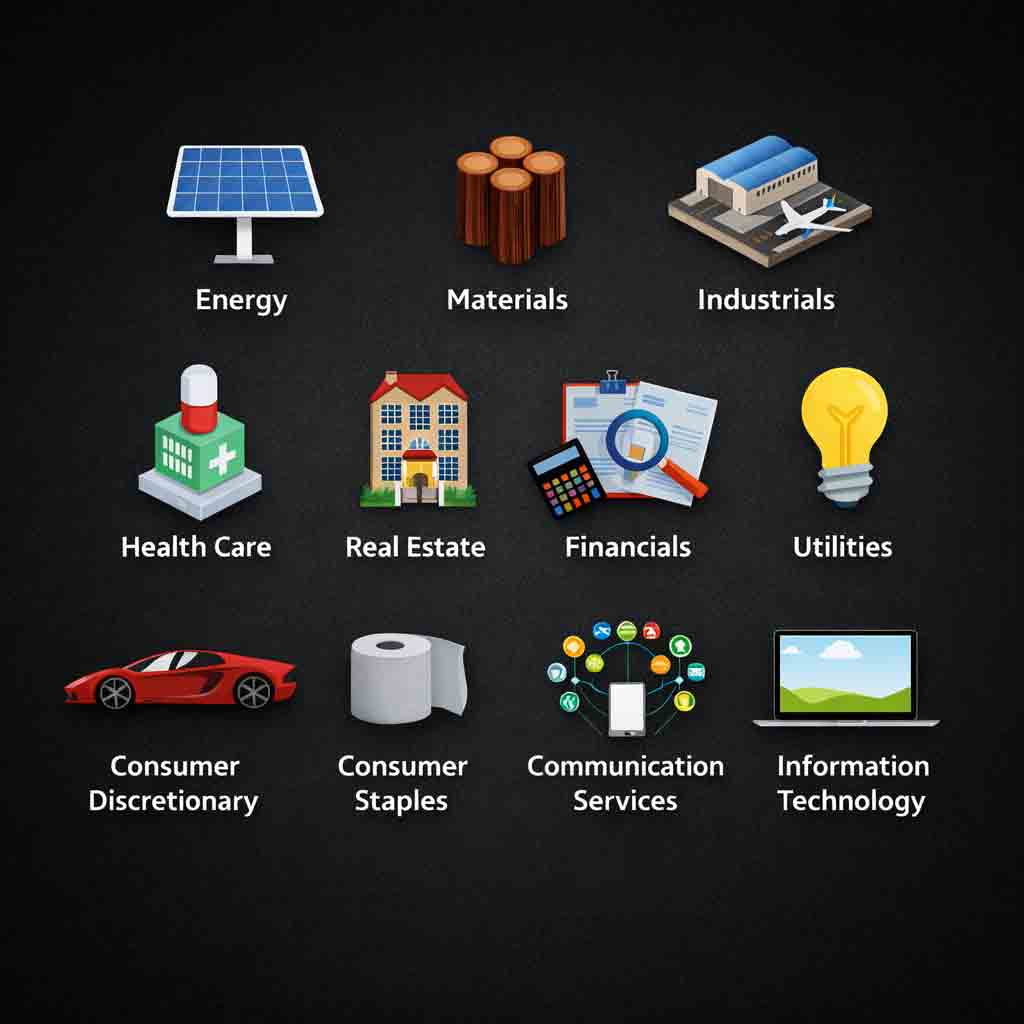
Technology during innovation waves, healthcare amid aging populations, or renewables during policy shifts — these sectors can lift strong companies even higher.
Compare your target company to its peers: Is it gaining market share? Does it have better margins, innovation, or cost advantages?
High-growth industries are often shaped by large institutions, billionaires, and government policies long before retail research catches up. Millions of traders read the same public reports and news — so standing out still often comes down to better networks and access to elite-level insights.
Interest rates, inflation, employment reports, and government policies directly affect corporate profits and investor sentiment.
Positive data (e.g., strong jobs numbers) tends to boost confidence and stock prices across the market.
Geopolitical tensions, rate hikes, or recessions can trigger uncertainty and broad sell-offs.
Successful fundamental investors stay aware of these macro drivers and adjust their outlook accordingly — combining company-level research with a big-picture view of the economy.
Macro events move fast — and by the time they make headlines, the market has usually reacted. Many professional traders stay ahead by tapping into real-time analysis networks and expert communities where economic data is interpreted and acted on before the crowd catches up.
Fundamental analysis remains one of the most reliable ways to evaluate a company’s real worth — by digging into financials, business quality, industry position, and economic context. It supports smarter, longer-term decisions and helps avoid overpaying for hype.
At the same time, the markets are not purely academic. Even the best fundamental research can leave retail investors reacting late to major moves. Many consistently profitable traders and investors combine solid analysis with high-performing communities — places where professionals share real-time insights, trade ideas, and sometimes even the exact positions the “elites” are taking before trends become obvious to everyone else.

Whether you’re building a stable dividend portfolio or chasing higher-growth opportunities, blending thorough analysis with elite insight communities and smart networking can give you a real edge to succeed early in the stock market.